Planck’s Despair
by Mark Meyer · Posted in: musings · nerdiness · color
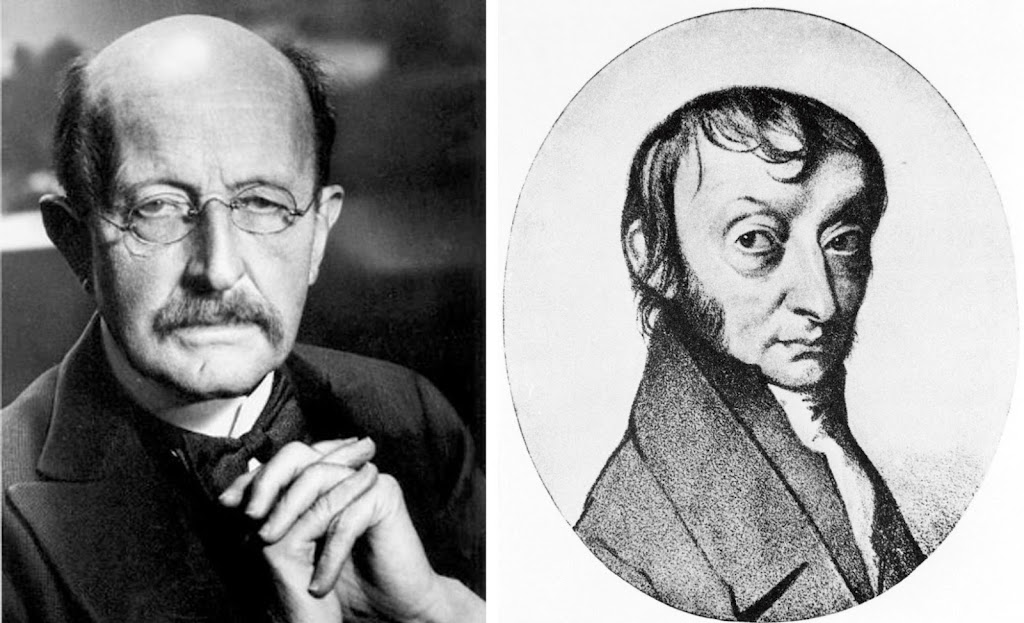
I sometimes feel bad for Max Planck. He single handedly invents quantum mechanics, wins the Nobel Prize in Physics in 1918, and at the end of the day is remembered for his minuscule constant:
.0000000000000000000000000000000006626068 (Joules per second).
This must have been humbling for Planck in a world dominated by stout constants like Michael Faraday's (96,485.3415) or Avogadro's number (6.0221415 × 10^23). One can only imagine the paphian mob of dewy-eyed women swooning at the sight of Lorenzo Romano Amedeo Carlo Bernadette Avogadro, count of Quaregna and Cerreto, after word of his enormous constant became public. Poor Max Planck, even a Nobel Prize can't compensate for a small constant—one of the smallest in all of science. (Incidentally, if you are impressed with a big constant, I have just the thing for you.)
Many people don't know it, and I'm sure it offers little consolation to Planck, but we have an homage to him built into just about every piece of photo editing software we use. In Adobe Lightroom it's a slider called 'temp,' short for temperature measured in degrees Kelvin. It's the temperature of a black body radiator. Max Planck is the one who finally figured out how radiation from a black body correlates to temperature and frequency. A black body is a theoretical construct—an idealized radiator that doesn't really exist—but we have everyday experience with things similar to black body radiators that glow when they get hot like tungsten filaments, lava, or electric stove elements. As these things get hotter, their color changes along a path from dark red through orange and yellow until eventually at very high temperatures they glow a blueish white. A back body is simply an theoretical version of these everyday things that absorbs all radiation falling onto it and emits it perfectly. Its color doesn't come from emitting just a single wavelength like a laser, but like all incandescent light, its glow is a smooth distribution of light across the entire spectrum. Its color comes from how the power is distributed throughout the spectrum. And not just the visible spectrum, get a black body radiator hot enough, say to temperatures you might find in a nuclear blast, and it will have a peak emittance in the gamma wave range. Planck's law describes the relationships between wavelength (or frequency), temperature, and power. What this means is that we can use Planck's law to determine the color of a black body radiator at a particular temperature. Give us a temperate like 6500ºK and we can figure out exactly what color the black body will be. Let's do it!
To begin we need Planck's law for black body radiation:
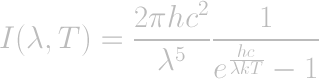
Here we have Planck's diminutive constant (h) mano-a-mano in the same formula with Boltzman's comparatively monstrous constant (k) (1.3807E-23) to say nothing of that strapping, muscular constant c (aka the speed of light, 2.998E+8 m/s) which Einstein kept like a pet in his pocket. λ (lambda) is the wavelength of the light (in meters) and T is the temperature in degrees Kelvin. If we plug in a temperature of 6500ºK and a wavelength of 555nm (555E-9 meters) we get 1.17476E+13 (watts per meter squared per steridian—but for our purposes the units don't really matter as long as we're consistent).
So what? you might say. Calculating a single wavelength doesn't do much, but we can take this formula and apply it to a range of wavelengths for a given temperature. Doing this results in set of numbers representing the power at each wavelength which we can then plot.
For 6500ºK it looks like this:

This is called a spectral power distribution (SPD), which is a very objective way to describe the color of a light source. The graph demonstrates a few interesting things. The peak emission for 6500ºK is around 445nm which corresponds to the boundary between blue and violet on the spectrum. Also, the black body doesn't just emit visible light, but also plenty of radiation in the ultraviolet and infrared range. It's clear looking at the graph that the tail is asymptotic and continues to emit very low power radiation well into the long wavelengths.
Compare the above graph to the SPD of 5500ºK (which is the color temperature of average noon light):
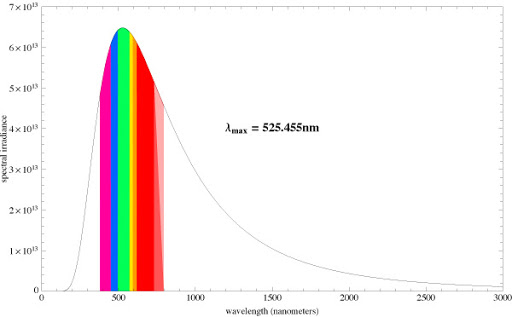
At 5500ºK the peak emission is around 525nm which corresponds to green light. It's no coincidence that this is also very close to the peak luminance sensitivity of our eyes.
Peak emission though is not enough to determine the color of the light. If it was, daylight would look green. To get from an SPD to a real color we need to add the human side by applying data from color observers. If we use the 1931 standard observer data we will end up in the familiar CIE XYZ space. Consulting a reference on how to do this is a little intimidating because it will give you the following formulas, which is where my eyes normally glaze over:
All these formulas mean is that we are multiplying Planck's formula with color matching functions and finding the area under the curve. Since we are dealing with discrete values, it's actually pretty easy to estimate the integrals numerically. I(λ,T) is just the result of Planck's formula for a given wavelength and temperature which we've been discussing. X(λ), Y(λ), Z(λ) is the CIE 1931 observer data, (aka color matching functions), which is simply a table with rows for each wavelength and four columns: the wavelength, x-bar, y-bar, z-bar. Pick a temperature (we'll use 6500ºK), then for each wavelength calculate the power using Planck's formula and multiply the x, y, z-bar values by it.
For instance this is the first row in the CIE 1931 for a wavelength of 380 nm:
[ 380 | 0.001368 | 0.000039 | 0.006450 ]
For 380nm wavelength and temperature of 6500ºK, Planck's formula give us 1.40055E+14. Multiply each column by this you'll get:
[ 1.91596E+11 | 5462163781 | 9.03358E+11 ]
Now do this for each row in the CIE 1931 data then take the sum of the X, Y, and Z columns. You should get some huge numbers:
[ X = 2.74066575E+15 | Y = 2.82939053E+15 | Z = 3.17107145E+15 ]
Use the standard formula to calculate x, y chromaticity (x = X/(X+Y+Z) y = Y/(X+Y+Z)) and you will get:
x = 0.313519312, y= 0.323647009
Nothing to it. This is where the black body white point for 6500ºK should fall on a chromaticity chart. It's simple enough that you can calculate it in a spreadsheet. You can download my excel version here.
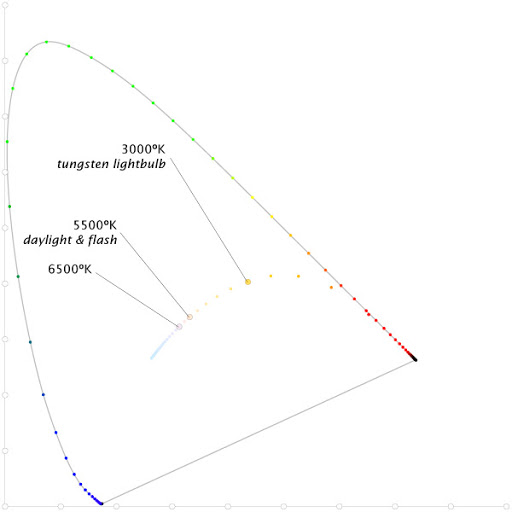
If you do this for a range of temperatures you can plot the number on the chromaticity digram and get a result that might look familiar.
Planckian Locus on CIE chromaticity diagram: