Exploring Color Theory with Blender
With just a few lines of code and some open-source software, you can begin creating images that illuminate the world of color space and geometry.
by Mark Meyer · Posted in: nerdiness · color
Warning: This post is for color nerds.
Moving on…
From time to time I post plots of color gamuts like the one above. Each time, I get email asking how I make them leading me to assume that the world's thirst for color nerdiness is going unquenched. I'm setting out to fix that in this post. There are several applications that produce graphics like these on demand including Apple's ColorSync Utility, ColorThink Pro, and Gamut Vision. These are all terrific applications and they all do a lot more than plot gamuts, but when I make these graphics, I do it from scratch using Blender and its Python scripting interface.
Blender is an open source 3D modeling/rendering application. Because you have to tell it explicitly what to do at every step, working with color geometry in Blender is a really good way to sharpen your understanding of the technical details. And unlike software dedicated specifically to plotting colors, Blender imposes no limitations on your creativity.
THE RGB CUBE
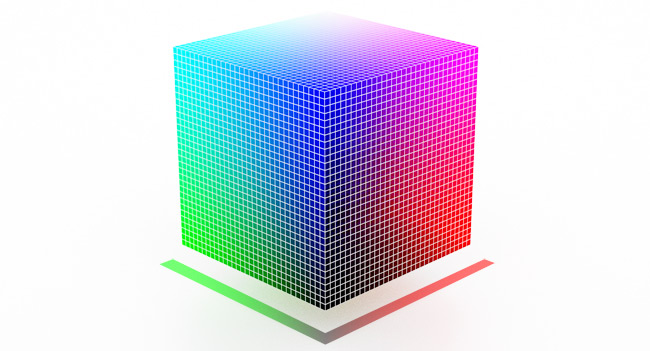
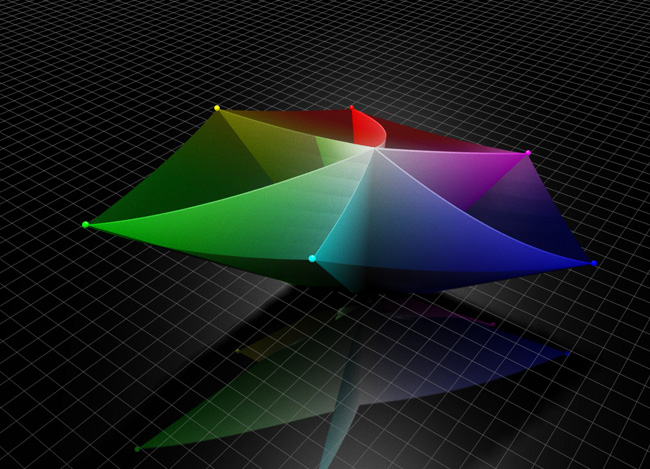
This is a good exercise to begin with: create a cube at the origin with sides one unit long and subdivide it a few times. Since all the points in the cube will have coordinates ranging from 0.0 to 1.0, you can assign each vertex an RGB color identical to the coordinates of its location and end up with the classic color cube. The color cube has some interesting properties: primary colors (RGB) and their complements (CMY) sit on opposite vertices. The most saturated colors are on the face of the cube with colors desaturating as you move into the cube. The line connecting the white and black points holds all the gray colors.
Relationship between the color wheel and the RGB Cube
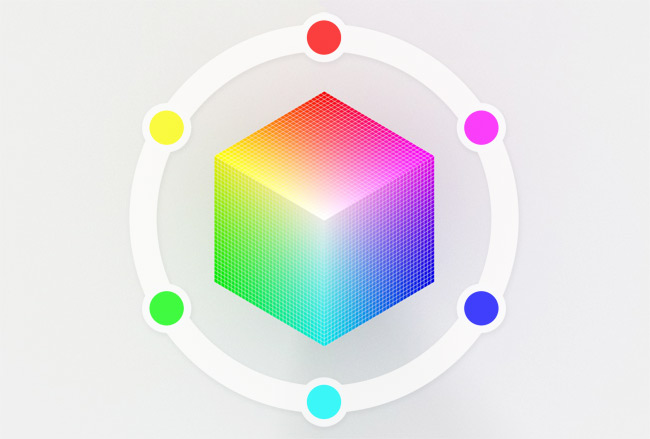
If you turn the cube so you are looking straight down on the white corner, you'll see the vertices of the three primary and three complementary colors arranged on a hexagon in the order of the color wheel. If you have used hue, saturation, and brightness (HSB) to specify colors and wondered why hue is specified in degrees, here's your answer. From this view you see red at 0º, and working counter-clockwise in 60º increments: yellow (60º), green (120º), cyan (180º), blue (240º), magenta (270º), and back to red (360º). These are the exact angles you'll see if you set Photoshop's color palette to HSB.
Comparing Color Gamuts in CIE XYZ Space
Comparing color spaces in RGB doesn't work because all RGB color spaces have the same numeric values ranging from zero to one-hundred percent—you always get the same cube—but these numbers don't represent the same colors. It's another way of saying that RGB color is device dependent—a triplet of RGB numbers by itself doesn't specify a color unless you also have a profile attached to it describing the device or color space those numbers are intended for. One of the main jobs of a color profile is to provide instructions to the color management system about how to turn a set of RGB numbers into coordinates in an device-independent system like CIE XYZ space. The above graphic uses simple matrices available from Bruce Lindbloom to convert two RGB cubes into XYZ spaces using the ProPhotoRGB profile and the Adobe RGB (1998) profile. Once in XYZ space it is easy to see that the ProPhoto gamut completely contains the smaller AdobeRGB gamut. You can also see that the white points (the top right vertex in this image) are aligned because I have adapted them to D50. It's a necessary step when comparing colorspaces with different white points.
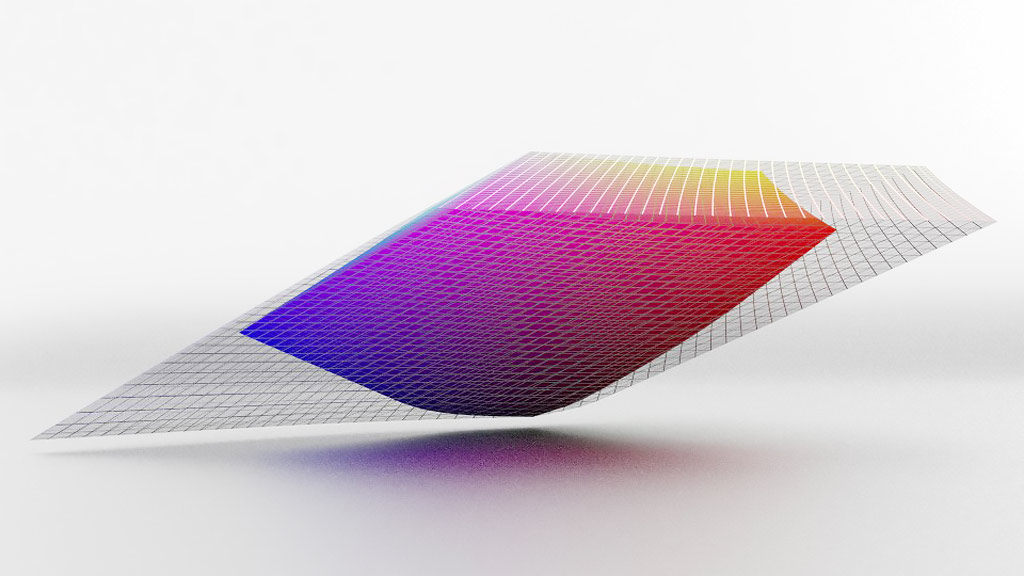
Comparing Color Gamuts in CIE Lab Space
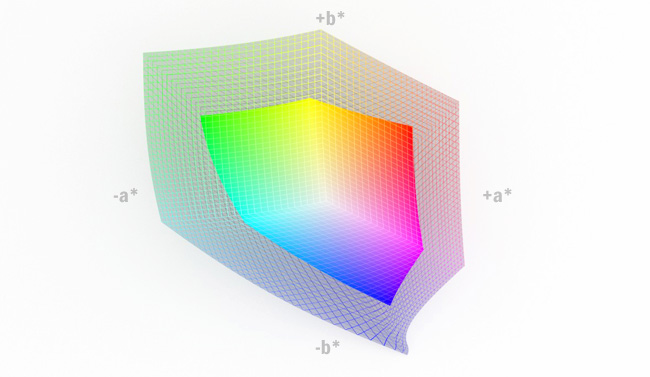
The same two spaces as above, but converted to Lab space. Looking straight down the L axis. This is the same model as the image at the top of the page viewed from a different angle. Lab space is more appropriate for comparing color gamuts because, unlike CIE XYZ space it attempts to be perceptually uniform.
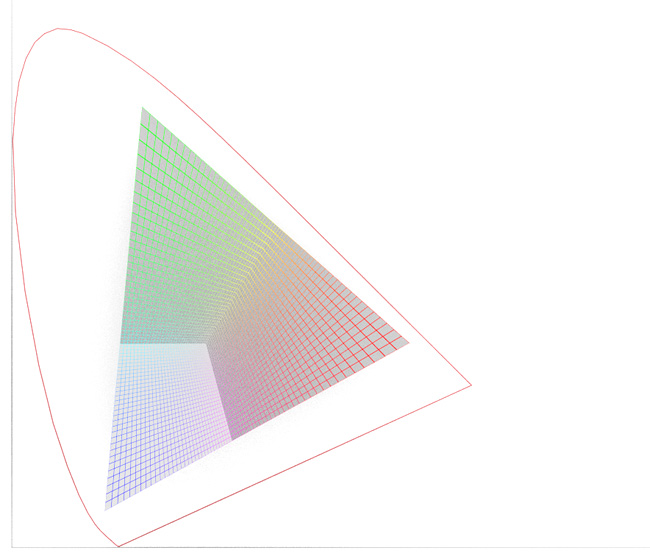
Adobe RGB gamut in xyY space
The thin, red line is where the spectral colors fall in this space. This is a view you don't often see because it's not especially useful and most software won't produce it out of the box. But it is interesting because if you move the camera above the xy plane and point it straight down with an orthographic view (no perspective), the result is a very familiar graphic:
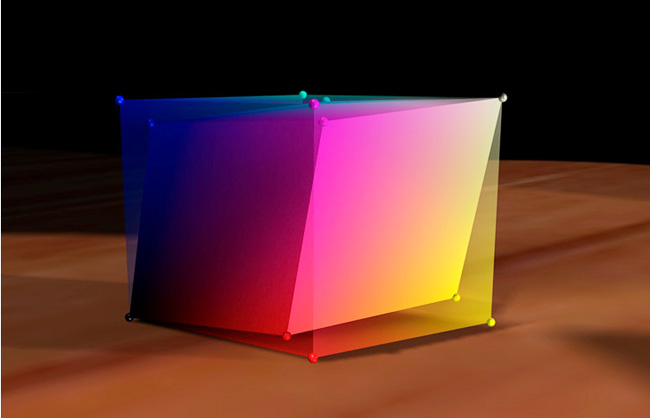
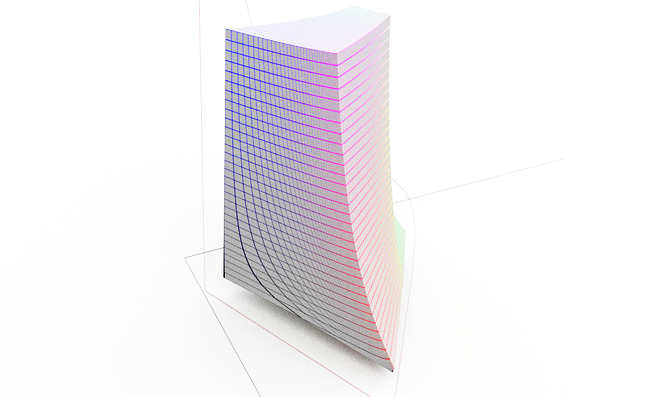
Other strange things
Blender places very few limits on your creativity. For instance, you can dismantle a model to expose its internals. The conversion from XYZ to Lab is a non-linear transformation. What starts out as simple triangles in the RGB cube connecting each primary vertex to the black and white points becomes warped in the transition to Lab space—a reflection of the non-linear nature of our color perception that is Lab space attempts to model.